It started with a management question
Imagine managing 600 vehicles across eight operational hubs.
Some are ready to operate. Others are approaching inspection deadlines, sitting in garages, accumulating mileage or approaching the end of their lease agreements.
Meanwhile, the financial department wants to understand where the money is going.
The fleet manager wants to know which vehicles need attention today.
And the operations manager wants to avoid discovering that a vehicle isn't available five minutes before somebody needs it.
All reasonable questions.
But they don't necessarily belong on the same dashboard.
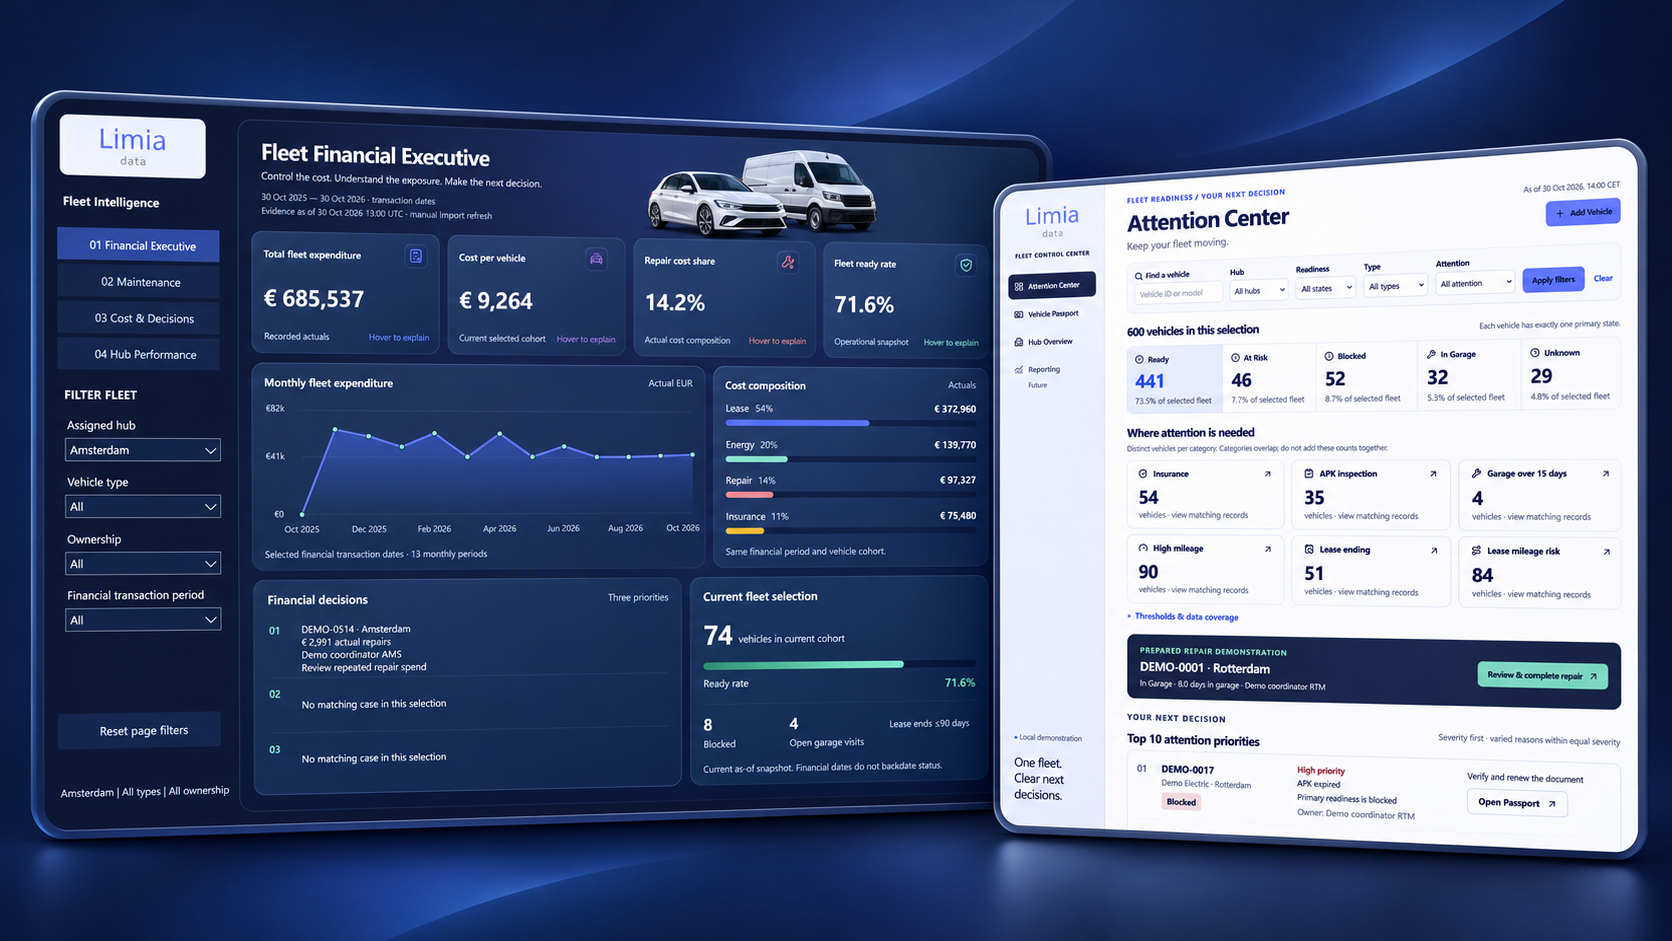
So I designed Fleet Control Center around two different management moments.
The first is about understanding the business.
What does the fleet cost? Which hubs drive expenditure? Where are the financial risks?
The second is about running the business.
Which vehicles need attention? Why? And what is the next practical step?
Same fleet. Different decisions.
€4.75 million. Interesting. Now what?
The first part of Fleet Control Center is built in Power BI.
The demonstration fleet contains 600 vehicles across eight hubs, with approximately €4.75 million in recorded expenditure.
From there, I can explore the financial picture by hub, vehicle category and reporting period.
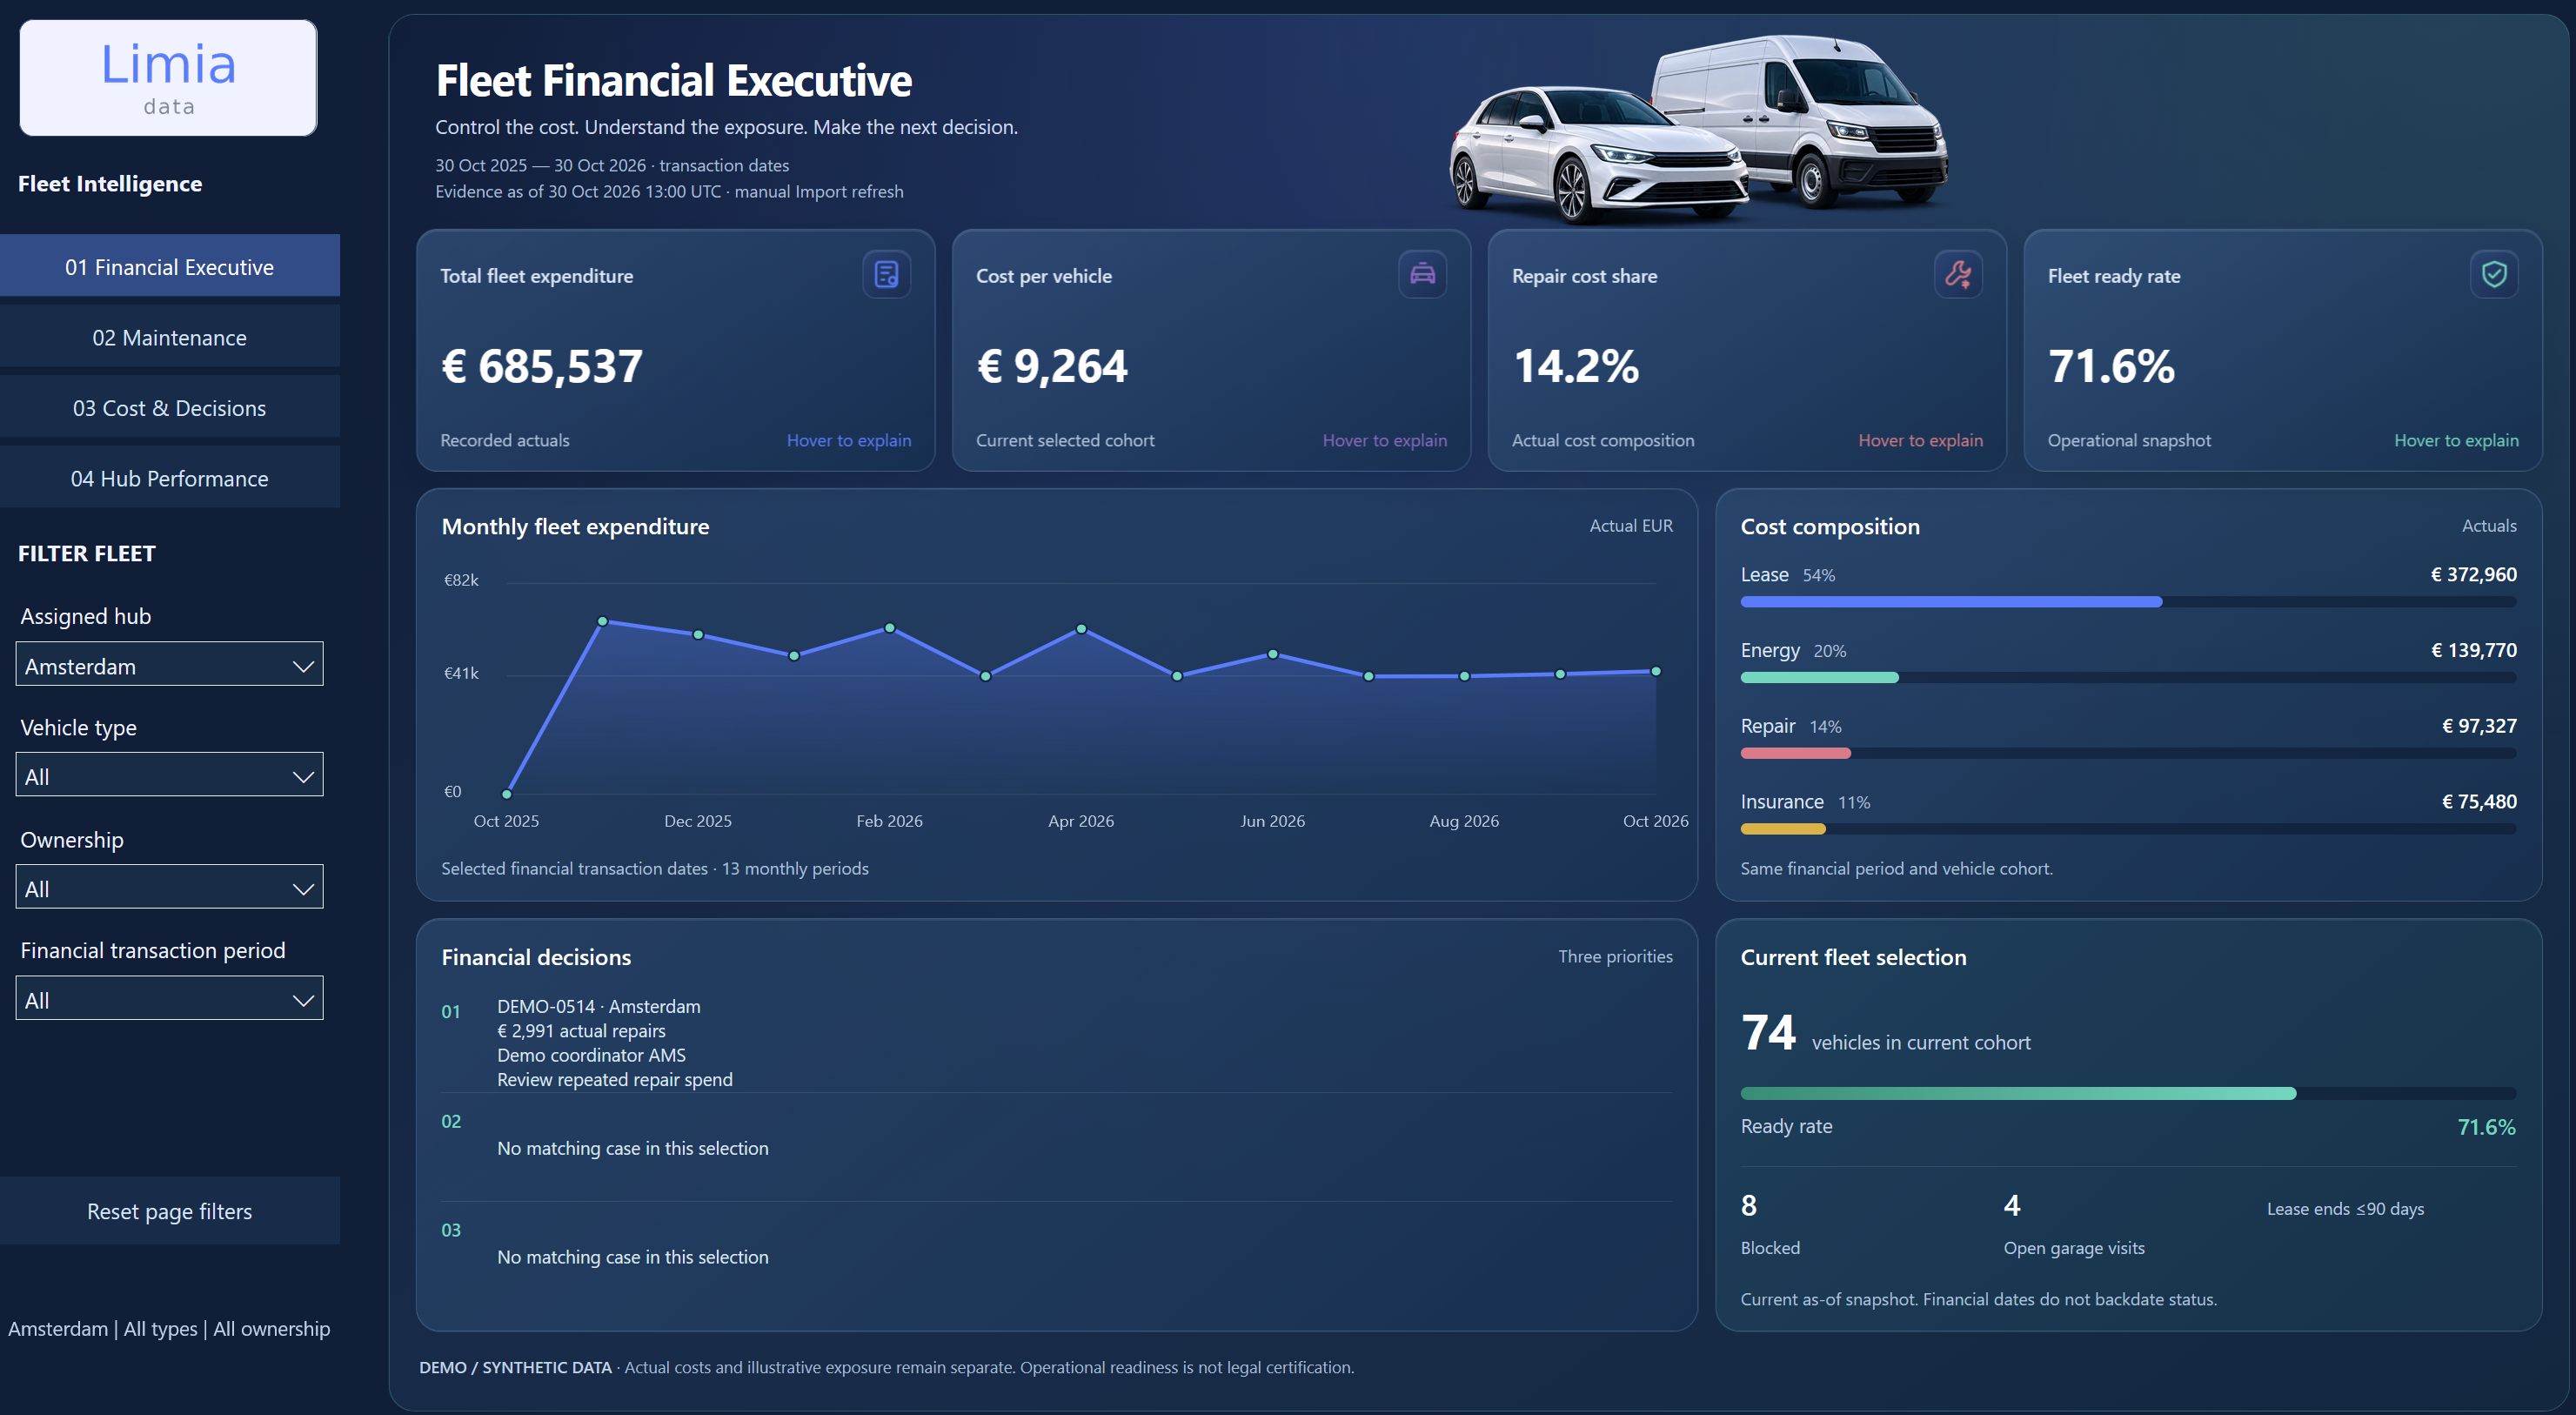
For example, selecting Amsterdam changes the view to €685,537 in expenditure associated with its 74 vehicles.
That's useful.
I can see the cost composition, understand trends and compare financial performance.
But there's an important limitation.
A financial number can tell me where to investigate. It doesn't automatically tell me which operational action to take.
A large repair bill might deserve investigation.
A vehicle sitting in the garage for three weeks might deserve a phone call.
And a vehicle with an expired APK inspection might deserve attention before it goes anywhere.
Those are three very different conversations.
Four dashboards. Four questions.
Rather than trying to squeeze everything into one enormous report, I built four Power BI views.
Fleet Financial Executive focuses on expenditure, cost drivers and management priorities.
Maintenance & Reliability examines garage activity, repair history and vehicle availability.
Cost, Downtime & Decisions separates recorded spending from estimated exposure and helps investigate expensive vehicles and potential decisions.
Netherlands Hub Performance compares readiness and operational attention across the eight hubs.
The reports use a shared visual language, interactive filters and explanatory KPI cards.
I also added something I particularly like: KPI cards that automatically flip when you hover over them.
On the front, you see the number.
On the back, you see what it means, how it's calculated and why it matters.
Because a number without a definition is a wonderful starting point for an unnecessarily long meeting.
But the reports are only half of the story.
From the dashboard to the vehicle
When I want to understand what's happening operationally, I move to the Fleet Control Center application.
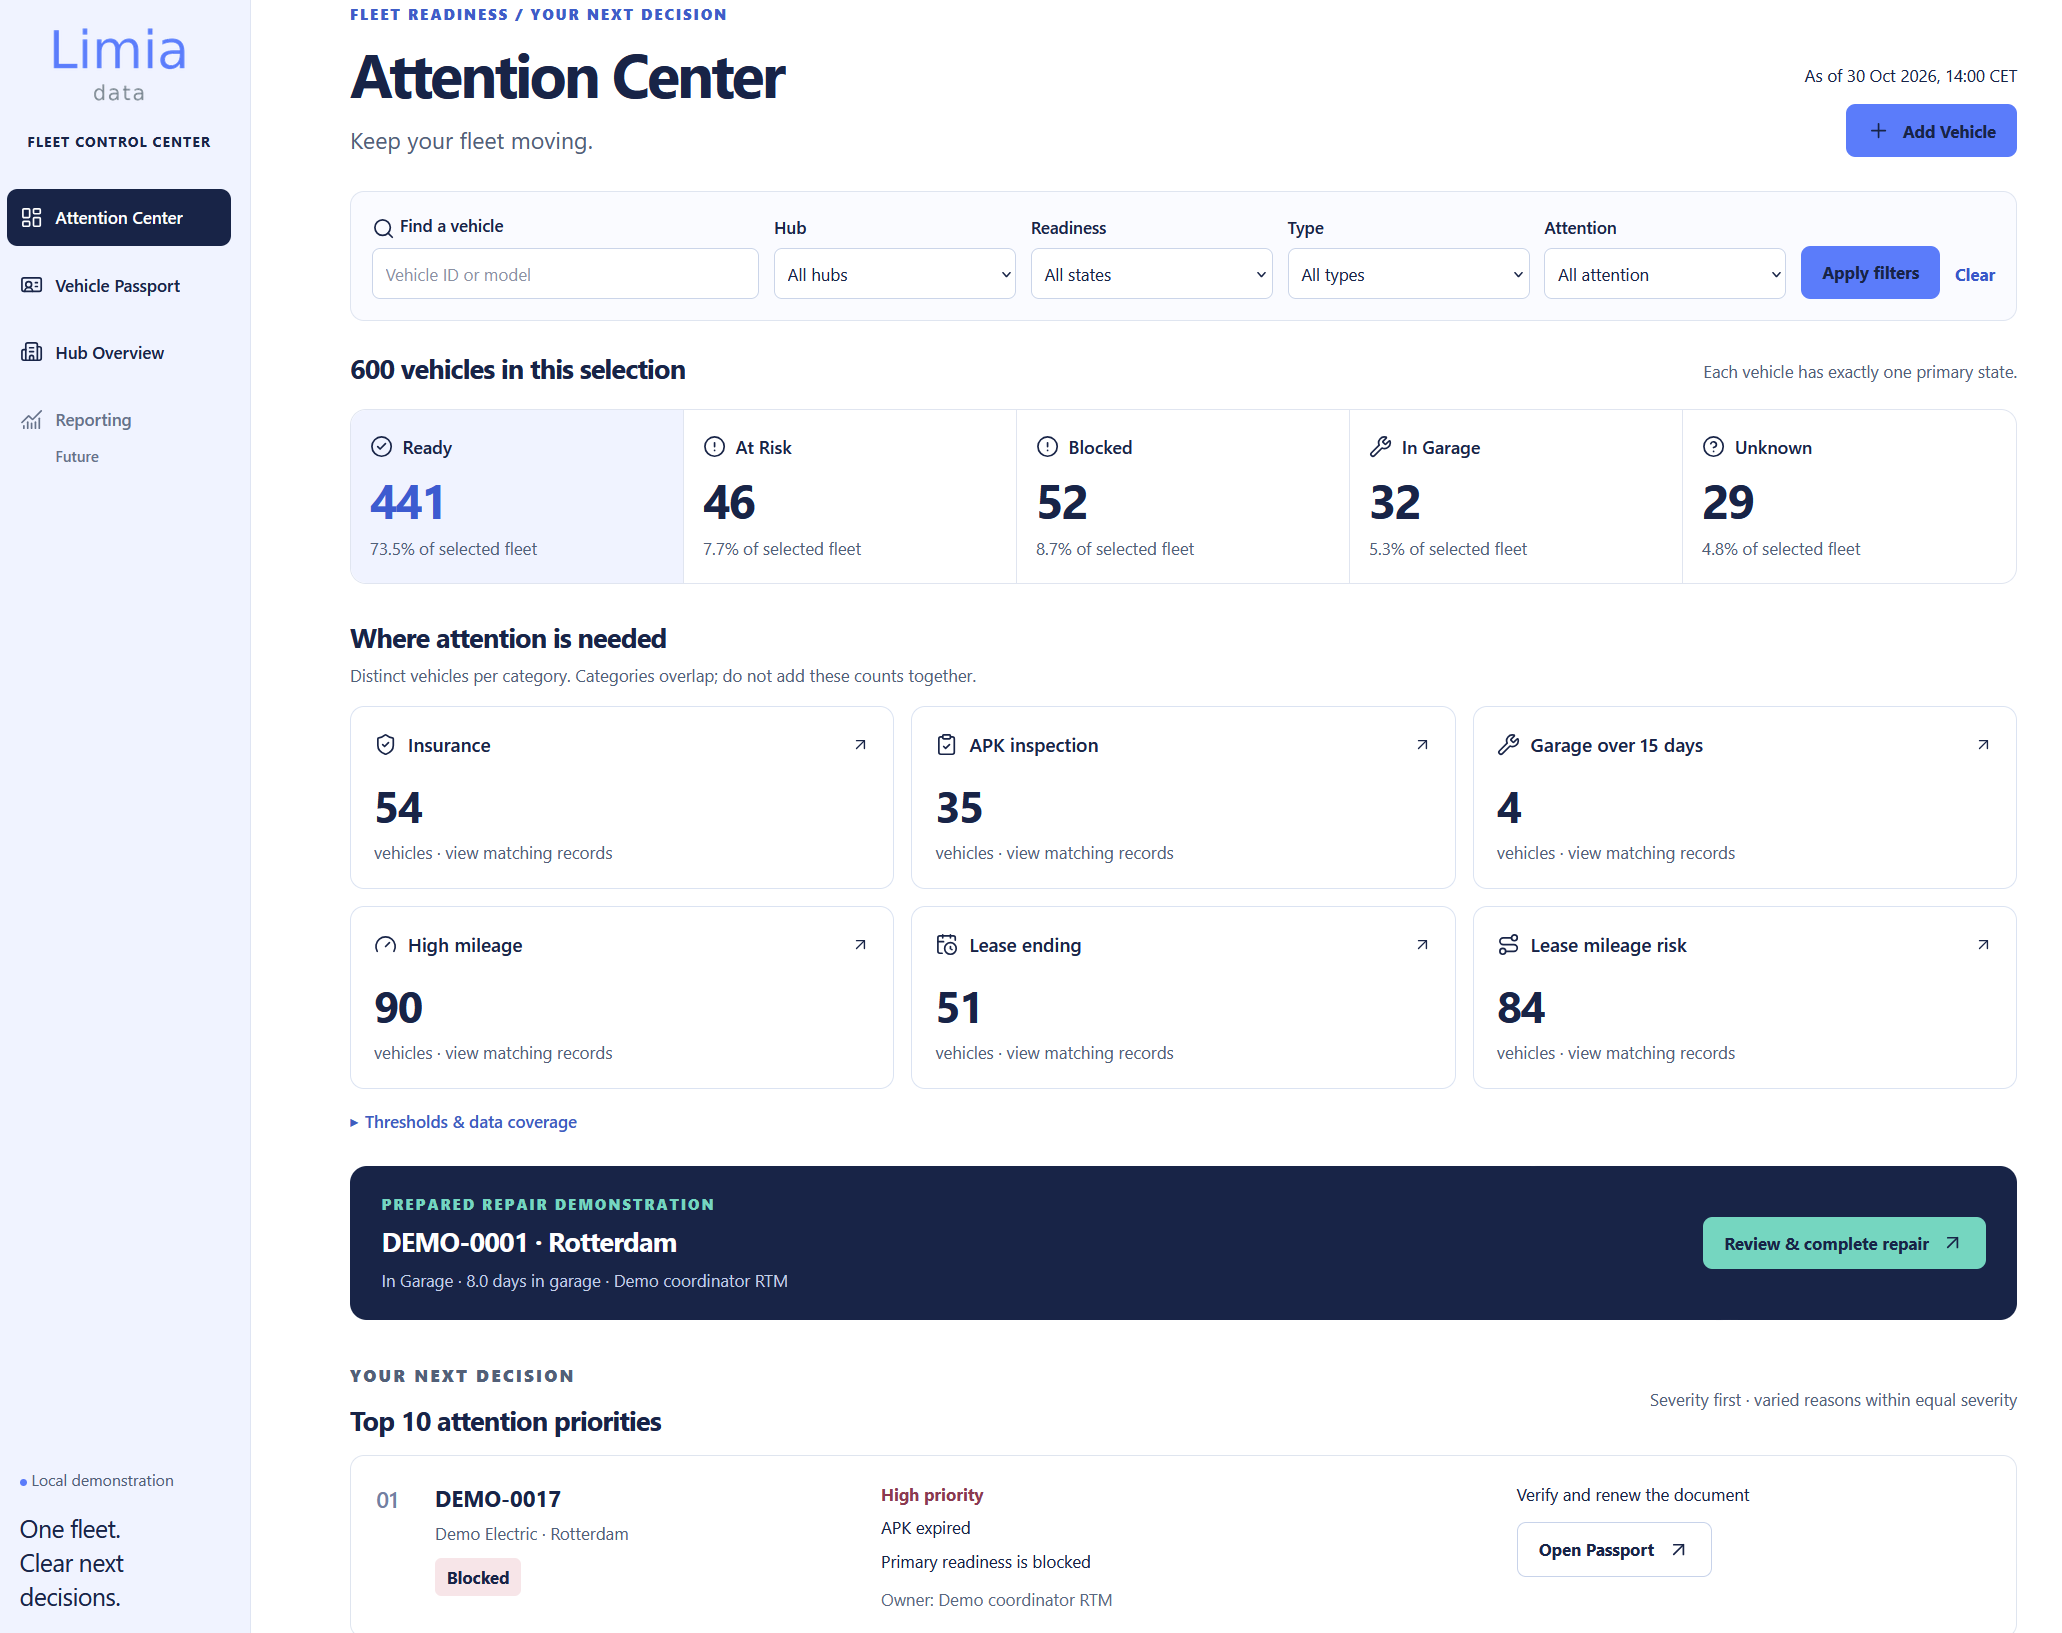
This is where the Attention Center becomes useful.
It brings different signals together: inspections, insurance, mileage, leasing and prolonged garage stays.
In the demonstration fleet, it identifies 35 vehicles requiring APK-related attention and four vehicles that have been in the garage for more than 15 days.
Those figures are not just decoration.
They are starting points for investigation.
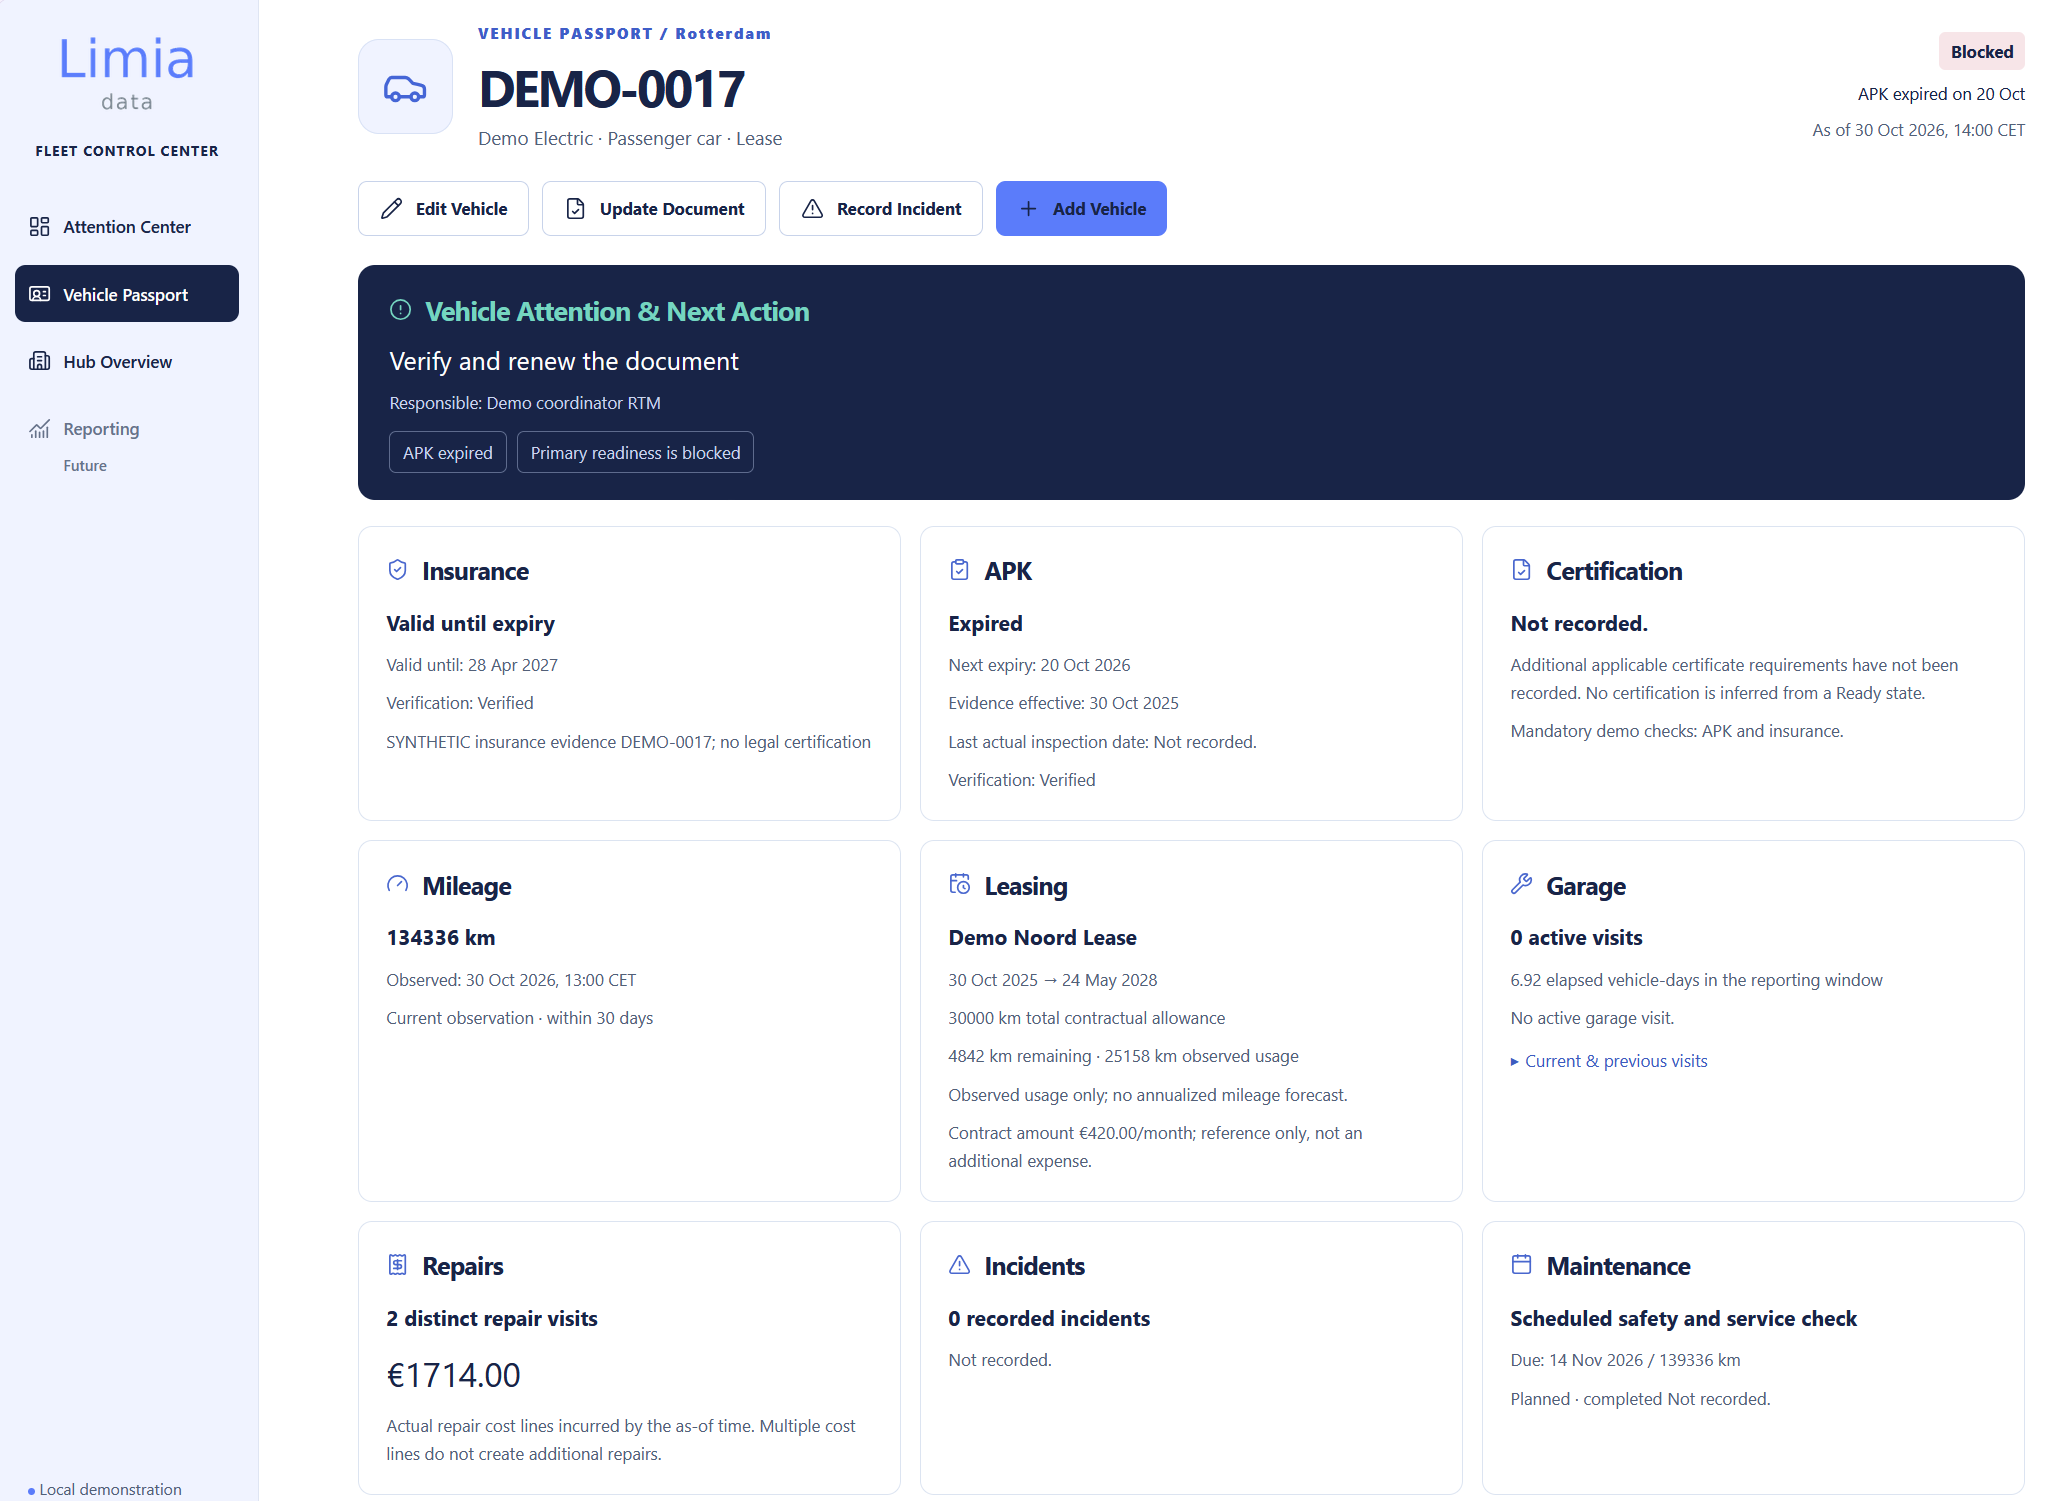
I select the APK category and open the Vehicle Passport for one of the flagged vehicles.
There I can examine its inspection status alongside relevant vehicle information, mileage, leasing and maintenance history.
In this example, the APK has expired.
Now I have a much better question for the responsible hub:
“Has the inspection been booked?”
Not a revolutionary question.
But certainly more useful than staring at another red KPI.
And that's really the point.
The system should help somebody move from a signal to a specific conversation, decision or action.
Why Power BI and Django?
I deliberately used two different interfaces.
Power BI is excellent for analysing financial and operational information: trends, comparisons, cost composition and management reporting.
But everyday operational workflows need something different.
A fleet manager may need to inspect an individual vehicle, update its records, investigate an alert or register that a repair has been completed.
For those workflows, I built a web application using Django and PostgreSQL.
The application provides the operational interface, while PostgreSQL stores the underlying demonstration records.
Power BI uses the same data foundation for reporting, with controlled refreshes to reflect changes.
The result is not an attempt to replace an existing fleet management system.
It's a demonstration of how financial analysis and operational follow-up can be connected around the same business questions.
And sometimes that's far more valuable than adding another dashboard.
The numbers need to be honest
One thing I cared about throughout the project was making the meaning of the numbers clear.
An actual repair invoice is a recorded cost.
A vehicle being unavailable might create financial exposure, but that does not automatically mean the business lost a particular amount of revenue.
An upcoming lease commitment is different again.
Those numbers shouldn't be casually added together just because they all have euro signs.
Fleet readiness also needs clear definitions. A Ready status is an operational classification based on the model's rules, not an official certification that a vehicle satisfies every legal requirement.
The same principle applies to alerts.
A vehicle can have more than one attention reason, so alert categories shouldn't be treated as mutually exclusive vehicle populations.
These distinctions are not the most glamorous part of dashboard design.
But without them, a beautiful report can become a very efficient way to misunderstand your business.
A working demonstration, not a finished fleet product
Fleet Control Center is a working LimiaData prototype built with simulated data.
It includes a functioning operational application, vehicle records and workflows, a PostgreSQL data foundation and four Power BI reporting dashboards.
The purpose is to demonstrate the approach, not claim that a complete commercial fleet platform has been deployed.
It doesn't use real customer fleet records, and it isn't presented as a production-ready compliance or financial system.
A real implementation would need to work with an organisation's existing processes, data sources, permissions, definitions and operational responsibilities.
And that's exactly where the interesting conversation begins.
What information already exists?
Which decisions are difficult today?
Where are people still checking spreadsheets, calling colleagues or searching for the latest status?
And what would make tomorrow morning easier?
The real goal was never another dashboard
I enjoy building dashboards.
I also enjoy a beautifully designed interface, and I probably spent more time perfecting those little glass cards than any reasonable person would admit.
But the design isn't the point.
The point is what happens after somebody sees the number.
Does it lead to a better question?
Can the right person investigate?
Is the next action clear?
And can we tell whether anything actually changed?
That's what I wanted Fleet Control Center to demonstrate.
Knowing the numbers is good. Knowing what to do next is better.
So here's my question:
If you had ten minutes with your fleet team tomorrow morning, what would you look at first?
Explore more LimiaData projects
I build practical demonstrations that connect business data, analytics and operational decisions.
If your organisation has plenty of reports but still struggles to turn information into action, let's talk.
Fleet Control Center (P007) is an independent LimiaData demonstration using entirely fictional data. Financial and operational results are illustrative of the prototype, not customer performance or realised business benefits.