Every finance manager knows the number
Total outstanding receivables.
Usually presented in a dashboard, neatly formatted, perhaps with a nice chart next to it.
Looks professional. Everyone nods.
Then someone asks:
“Are we actually getting better at collecting our money?”
And suddenly, knowing the total isn't quite enough.
Which customers are driving the risk? How much is seriously overdue? Is the situation improving? And which invoices should the team investigate first?
Those are the questions that interest me. So I decided to build something around them.
Meet LimiaData Receivables Pulse
Not just another Power BI dashboard.
A working financial management prototype connecting a web application, a financial database and three decision-focused reporting views.
The idea was simple: What if we could move naturally from registering financial information to understanding what deserves management attention?
Without spending the first 20 minutes of every meeting trying to establish which Excel file contains the latest numbers.
1. Start with the financial records
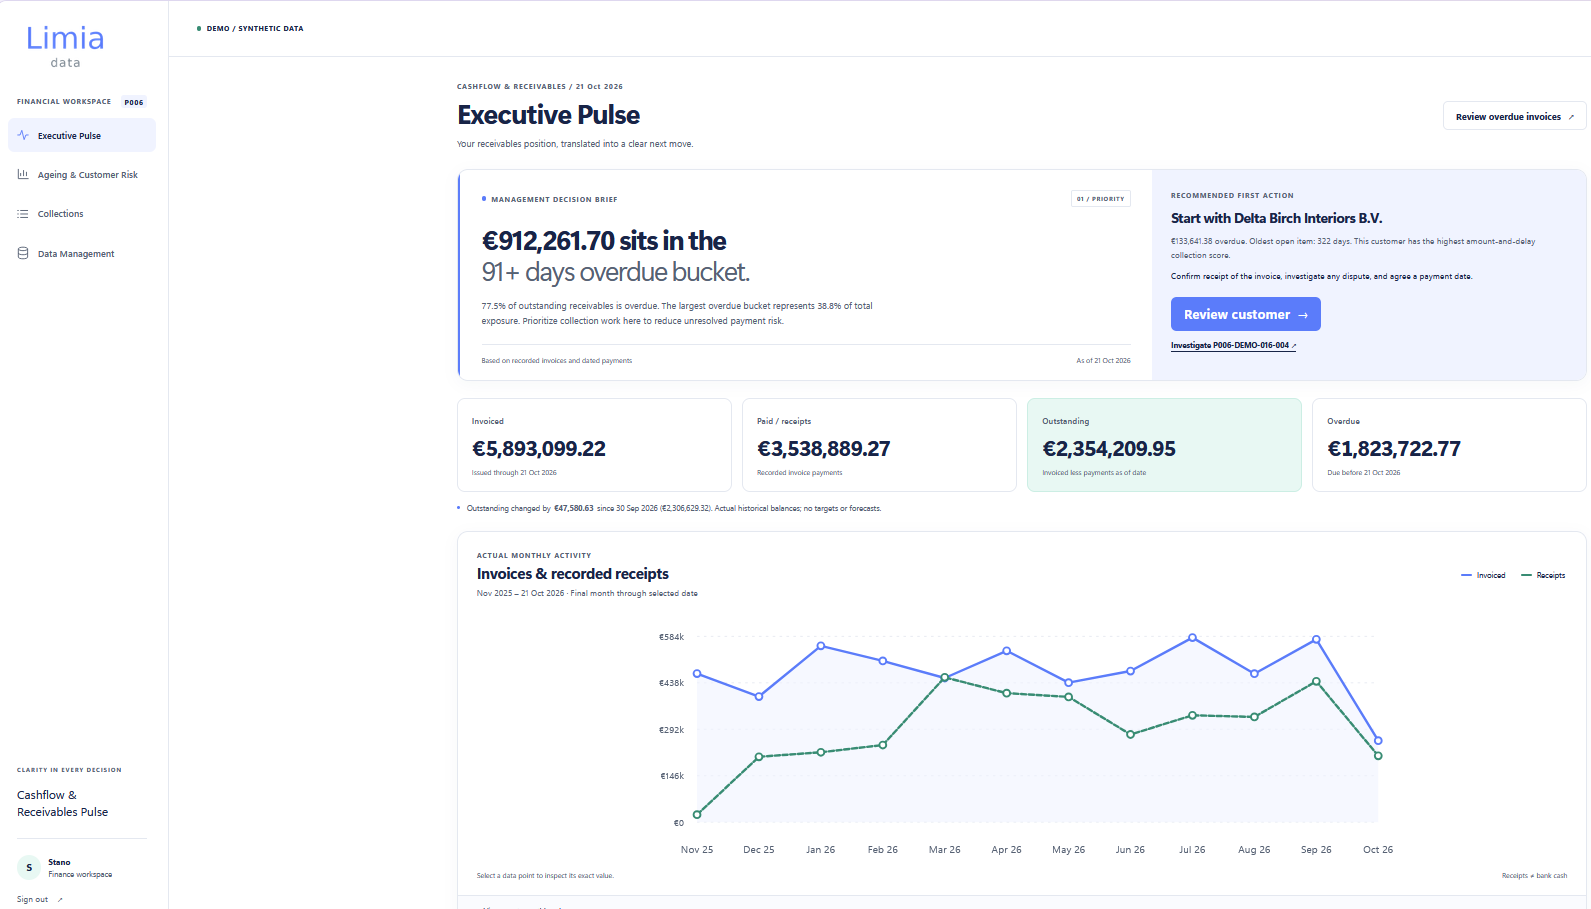
Behind the dashboards is a working Django web application.
It allows users to:
- Manage customers and their details.
- Register and review invoices.
- Record full or partial payments.
- Track outstanding balances and overdue positions.
- Investigate individual customers and invoices.
The application uses PostgreSQL to store the financial records.
Payments update invoice balances through validated financial logic, rather than manually adjusting dashboard numbers.
Because if the data underneath is unreliable, even the prettiest dashboard becomes very expensive decoration.
2. From financial records to financial intelligence
The next step was Power BI.
But instead of building one large dashboard containing everything, I divided the reporting into three management questions.
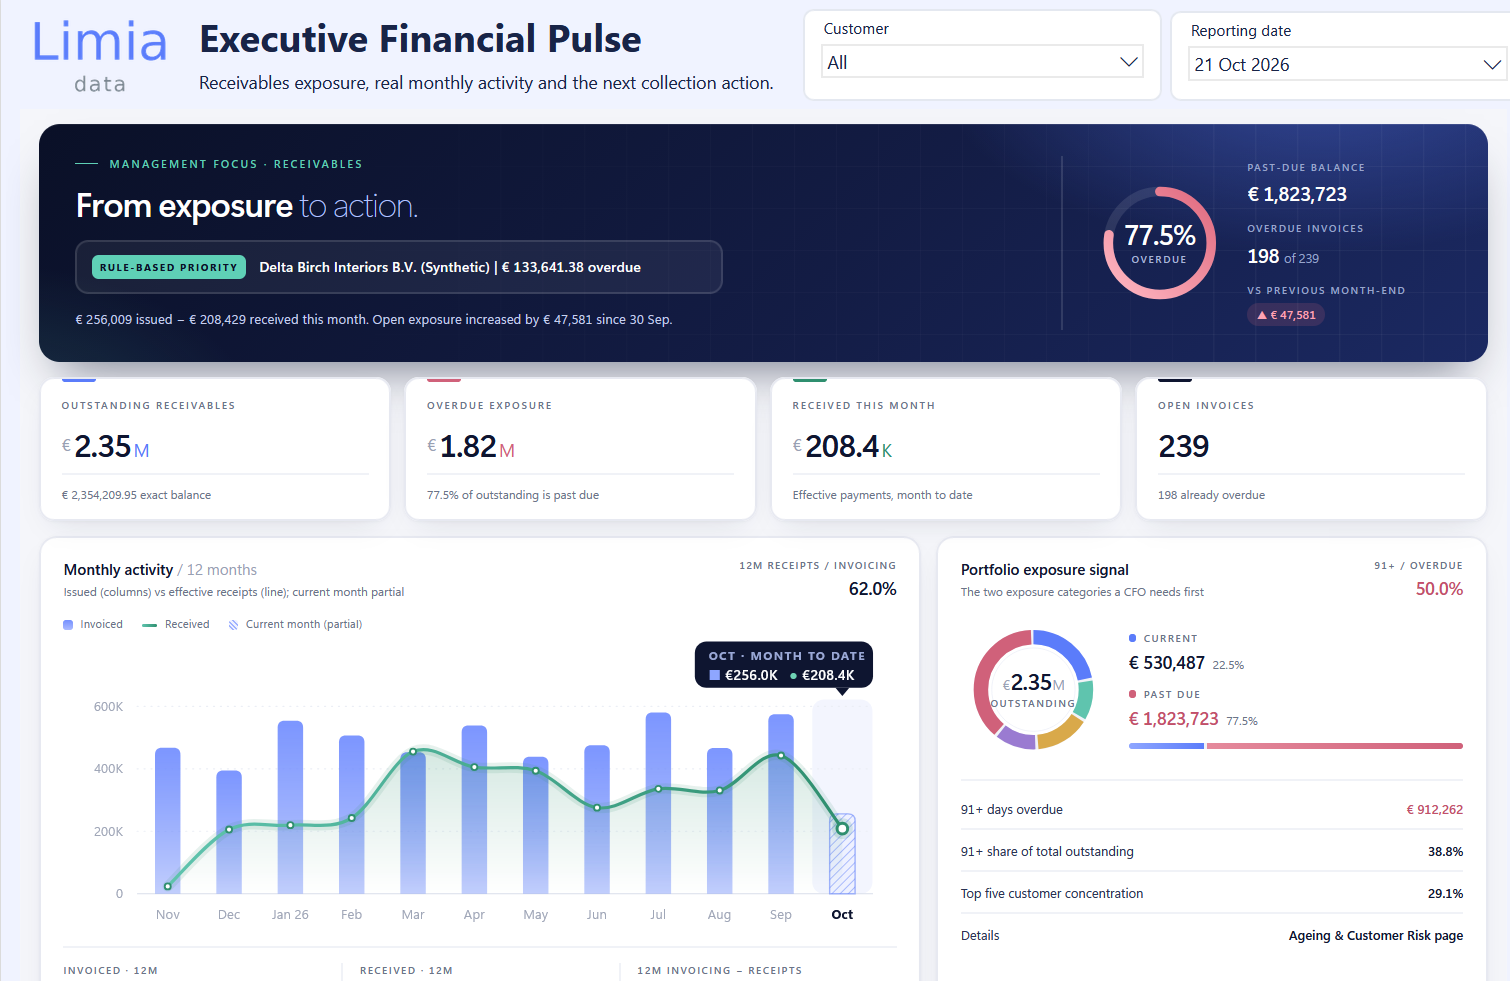
Executive Financial Pulse — What changed?
The executive overview provides a clear picture of receivables performance.
How much is outstanding? How much is overdue? Are invoices growing faster than payments received? And what is happening to the open balance?
It combines financial KPIs, monthly activity and a management-oriented explanation of what deserves attention.
The goal isn't to show every available number.
It's to understand the financial position quickly enough to make a decision.
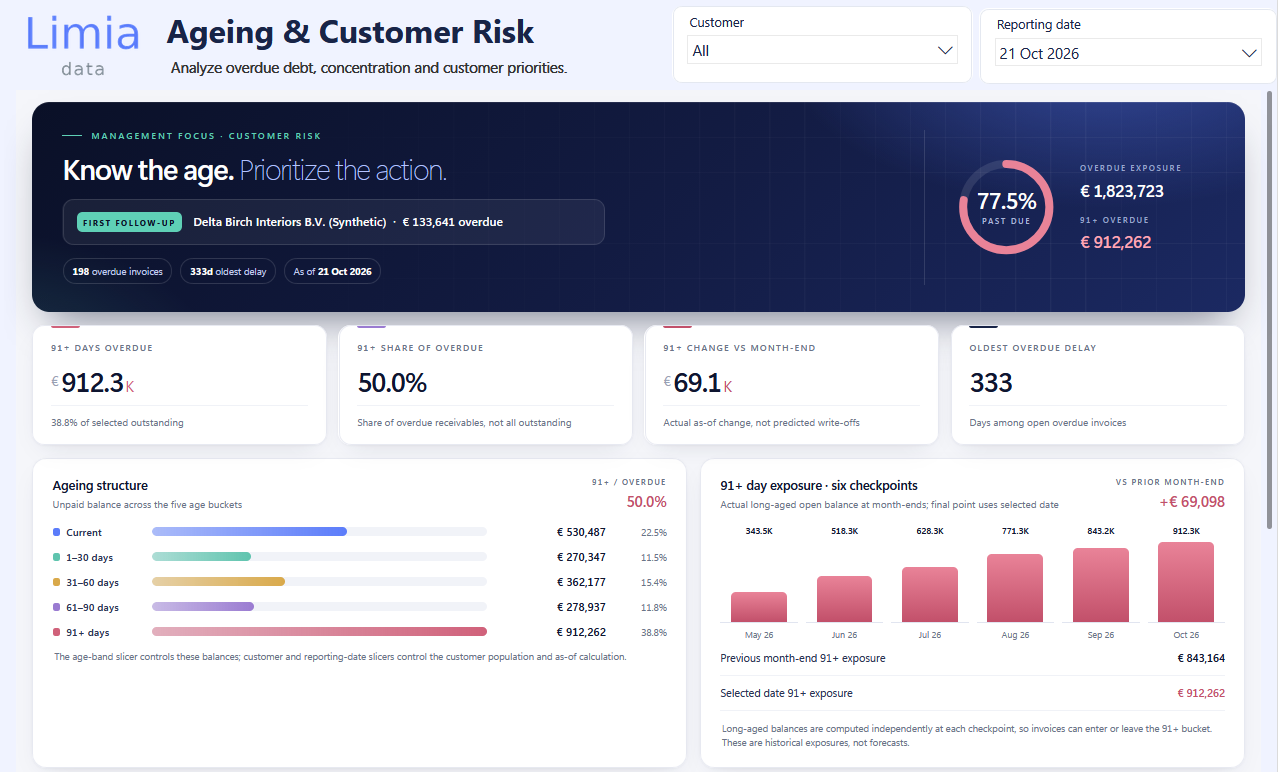
Ageing & Customer Risk — Where is the problem?
An overdue balance tells you something. Its age tells you considerably more.
This dashboard examines overdue composition, long-aged exposure, customer concentration and how receivables risk develops over time.
It also highlights customers for follow-up using transparent rules based on financial exposure and overdue age.
Not a mysterious AI score. Not a prediction of who will pay.
Just calculations you can explain to a finance manager without requiring a PhD in dashboard archaeology.
In this demo snapshot, €912,261.70 falls into the 91+ days overdue bucket: 50.0% of overdue receivables. That bucket is approximately €69.1K higher than at the previous month-end.
The rules-based customer follow-up shown is Delta Birch Interiors B.V. (Synthetic), with €133,641.38 overdue. That is a prioritization signal, not a predicted payment outcome.
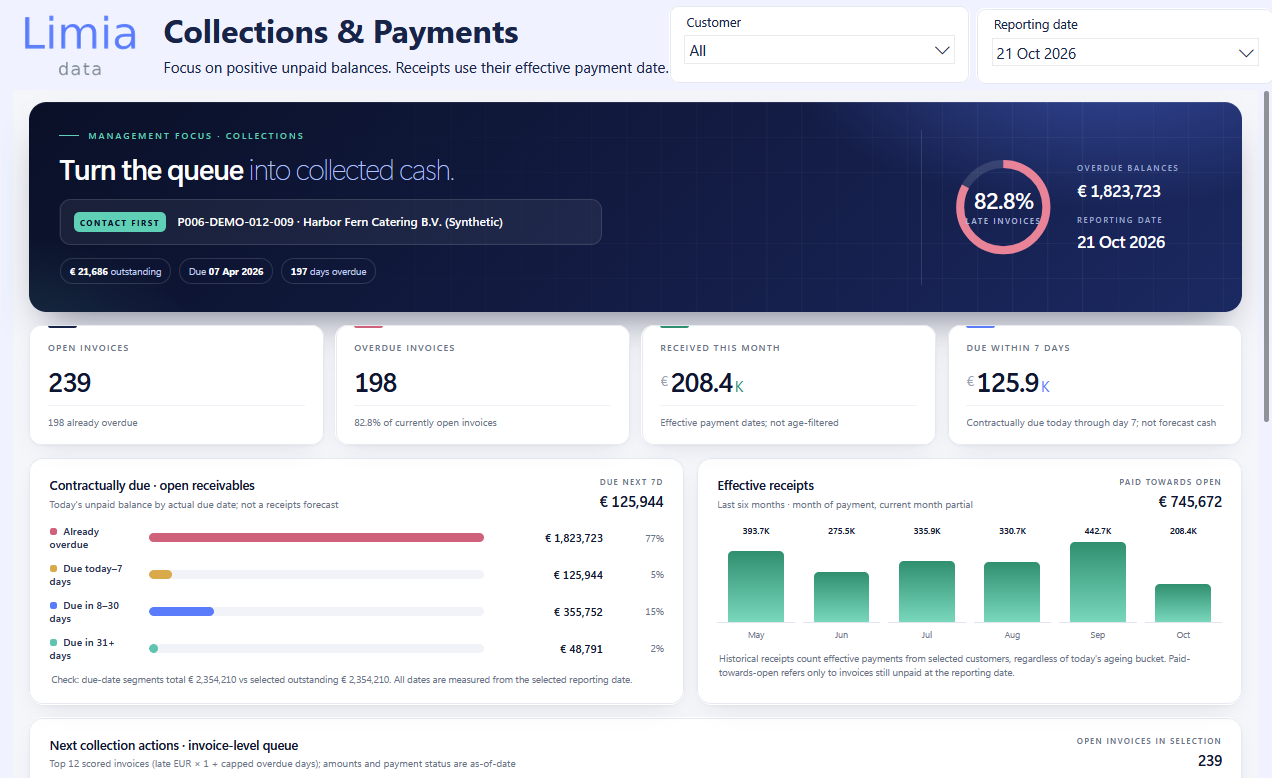
Collections & Payments — What needs attention next?
This is where the analysis becomes more operational.
The dashboard identifies open and overdue invoices, amounts approaching their due dates, actual payment activity and invoice-level collection priorities.
Rather than stopping at “we have overdue receivables,” we can investigate which invoices need attention and why.
That distinction matters.
A financial report should support the next action, not just describe yesterday's problem.
Of 239 open invoices, 198 are overdue. Another €125,944 is contractually due from the reporting date through the following seven days. Those due-date amounts are obligations, not a cash-receipts forecast.
3. What does the demo actually reveal?
I built the prototype using a fully synthetic financial dataset, representing fictional customers, invoices and payments.
In the demonstration snapshot of 21 October 2026, the system shows the following figures:
Synthetic receivables snapshot · 21 October 2026
All amounts in EUR. Snapshot figures from the verified fictional P006 dataset, not actual client accounts.
Why the ageing breakdown matters
One finding immediately stands out:
€912,261.70 is over 90 days overdue — approximately half (50.0%) of the €1,823,722.77 overdue balance.
That is a more useful management discussion than simply announcing that approximately €1.82 million is overdue.
October-to-date issued invoices are approximately €256,009 and effective receipts approximately €208,429, leaving an increase in open exposure of about €47,581 since 30 September 2026.
Which customers account for the oldest debt, and where should the team focus first? The three views help answer that without manually reconstructing the figures.
All amounts are from the 21 October 2026 synthetic demonstration snapshot, not real client balances.
4. The technology matters. The decision matters more.
Underneath the prototype:
- Django provides the financial management application.
- PostgreSQL stores the customer, invoice and payment records.
- Power BI transforms those records into executive, risk and collections intelligence.
Power BI imports the data from PostgreSQL and updates when refreshed.
The reporting supports customer, reporting-date and relevant ageing filters, allowing the financial picture to be investigated from different perspectives.
There is nothing particularly revolutionary about each technology on its own.
The interesting part is connecting them around a useful business question.
What changed? Where is the exposure? What deserves attention next?
That's where reporting starts becoming decision support.
5. What this prototype is — and isn't
This is a working LimiaData demonstration, not a deployment for a real customer.
All companies, invoices and payment transactions are fictional.
The solution demonstrates receivables management and financial decision support. It is not a bank cash-flow forecast, an automated debt-collection service or a replacement for a company's existing accounting system.
The current Power BI prototype uses manual data refresh. Collection priorities are rules-based, not predictions of payment behavior.
These distinctions are important.
Good financial intelligence should be able to explain both what the numbers tell us and what they cannot tell us.
6. The bigger idea
Most businesses don't need another system simply because technology makes it possible to build one.
They need their existing information to become more useful.
Sometimes that's a better dashboard. Sometimes it's a lightweight application that connects scattered records. And sometimes it's simply one clear explanation of what changed and what deserves attention.
With Receivables Pulse, I wanted to demonstrate how those pieces can work together.
From managing a customer invoice to investigating portfolio risk and identifying the next collection priority.
Less searching. More understanding. Better decisions.
That's the kind of practical business intelligence we're exploring at LimiaData.
Take Control of Your Receivables.
Have financial data but struggle to turn it into clear management priorities?
Let's explore how a similar decision-support approach could work with your existing systems.
LimiaData — From transaction to decision.
Demo / Synthetic Data · LimiaData Work & Lab